
Most forecasting tools fail on data volume, not on the model. The thresholds are published. Check yours against them before you sit through a demo.
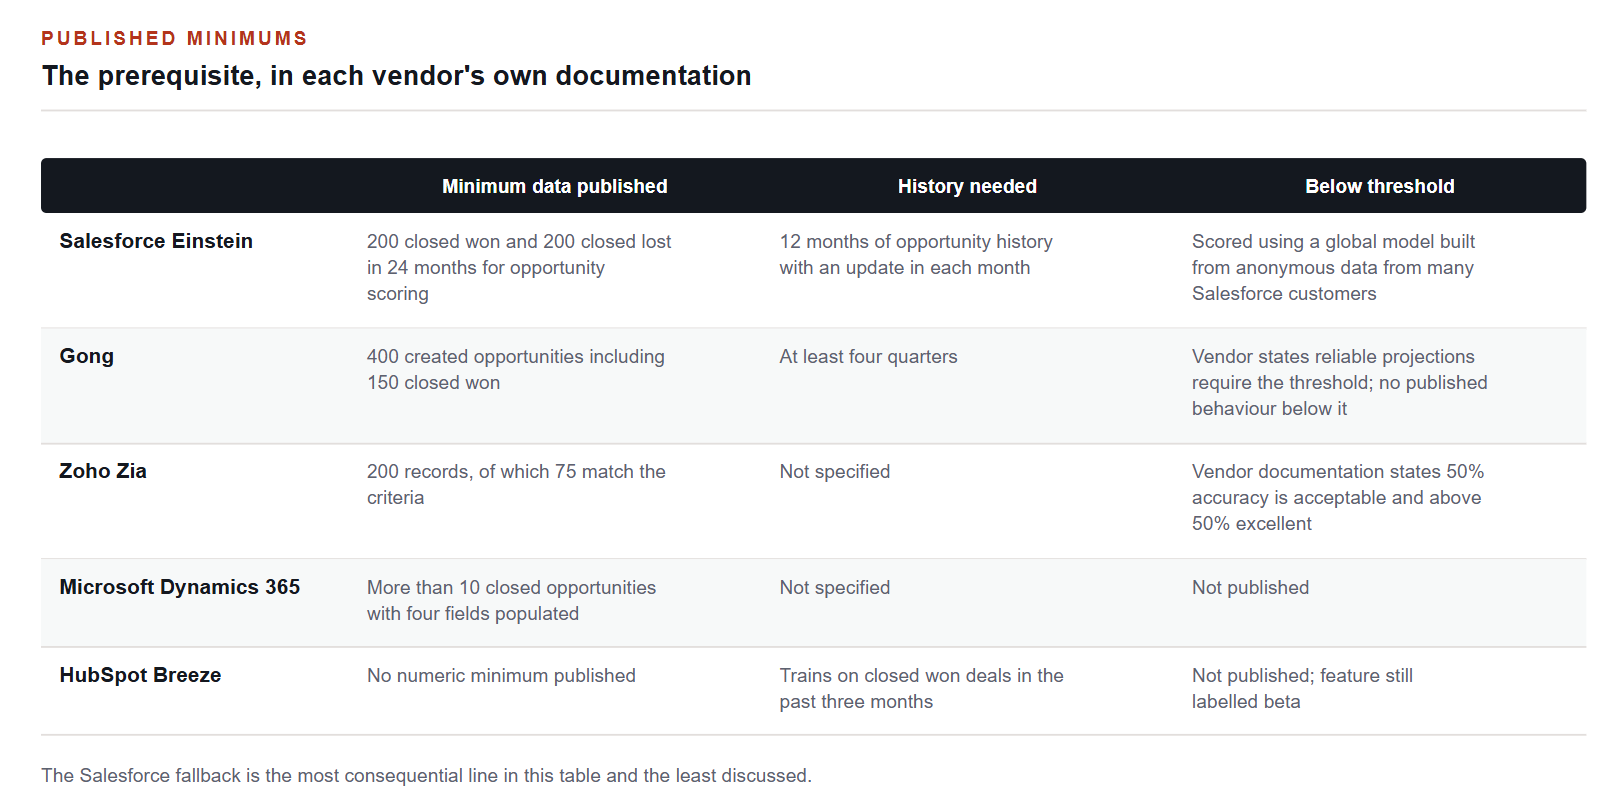
Minimum data requirements as published by each vendor. Where a vendor publishes no minimum, we say so. These are the vendors' own numbers, not our estimates.
Forecasting tools are sold on the model. They fail on the data. Every major vendor publishes a minimum data requirement, those minimums vary by an order of magnitude, and almost nobody checks their own numbers against them before the evaluation starts.
Do that first. It takes an afternoon and it will disqualify some of the shortlist.
The thresholds
Salesforce publishes the most detailed requirements. Opportunity scoring needs at least 200 closed won and at least 200 closed lost opportunities in the last 24 months, each with a lifespan of at least two days. Lead scoring needs at least 1,000 leads created in the last 200 days, of which at least 120 converted. Einstein forecasting needs at least 12 months of opportunity history with at least one update in each of the past 12 months, and the amount field populated on at least 80 per cent of open opportunities.
Gong states that its research suggests reliable projections, exceeding 90 per cent accuracy, require at least 400 created opportunities of which 150 are closed won, spanning at least four quarters. The threshold is published. The research behind it is not.
Zoho requires a minimum of 200 records, of which 75 should match the criteria. Microsoft Dynamics 365 asks for more than 10 closed opportunities with four fields populated. HubSpot's Breeze forecasting trains on closed won deals from the past three months and publishes no numeric minimum at all, and the feature remains labelled as beta.
What happens if you fall short is the part to read carefully
Salesforce answers this explicitly, and the answer deserves more attention than it gets. If you do not have enough opportunity data to build your own predictive model, Einstein uses a global model, and the global model uses anonymous data from many Salesforce customers.
Below the threshold, you are not being scored on your business. You are being scored on the aggregate patterns of other companies, and the interface will not tell you which is happening.
That is not necessarily wrong. A global model may well outperform a thin local one. But it changes what the number means, and it is the sort of thing a revenue leader should know before presenting a forecast to a board.
Zoho's documentation is unusually frank in a different way, stating that 50 per cent accuracy is considered acceptable while more than 50 per cent is excellent, with a worked example showing a live model at 38 per cent.
Nobody has published a head-to-head study
We looked for a study, by any vendor or any academic, comparing AI pipeline forecasting against manual roll-up on the same deals over the same periods with a stated method. There is not one.
For a category whose entire proposition is that it beats the manager roll-up, that absence is the most important thing a buyer can know. Vendors publish accuracy claims without baselines: one states 96 per cent accuracy by week two with no sample, no baseline and no definition of accuracy; another quotes an error band of 5 to 10 per cent by week three, which is a band rather than an accuracy rate and is frequently reported as though it were the latter.
What the forecasting literature does say
The best-evidenced findings in forecasting science come from outside sales, and they are not what the category implies.
In the M4 competition, published in the International Journal of Forecasting in 2020 across 100,000 time series, of the seventeen most accurate methods twelve were combinations, and the six pure machine-learning methods all fell below a benchmark combination of three simple statistical methods.
Work by Fildes and colleagues on more than 60,000 forecasts from four supply-chain companies found that positive adjustments, meaning adjusting a forecast upwards, were much less likely to improve accuracy than negative adjustments and were made in the wrong direction more frequently, suggesting a general bias towards optimism. Large adjustments tended to improve accuracy while smaller ones often damaged it.
That maps suggestively onto rep commit inflation, and we should be clear that the mapping is an inference. This literature is about supply chains and time series, not sales pipelines. It is the best evidence available and it is not evidence about your pipeline.
The circular citation problem, which you should know about before you cite anything
The statistics in this category are unusually unreliable, and the pattern is documented.
The most-quoted figure, that sales forecasts are accurate less than half the time, is a misreading of a Gartner finding about confidence: 45 per cent of sales leaders and sellers had high confidence in their forecasting accuracy. A leading vendor's benchmarks page sources every figure on it to other blogs, one of which is a competing forecasting vendor, none with a sample or a method. Another post from the same vendor attributes a statistic to a 2020 Gartner report while linking to an article about a 2013 study.
The most-cited genuine research, from CSO Insights, reports that the win rate of forecast deals is 46.9 per cent and that 48.2 per cent of deals closed as originally forecast. That is real, and it is from 2017, and the publisher has published nothing since 2020.
How to run the evaluation
Count your closed won and closed lost opportunities over 24 months, and your months of continuous history, before the first demo. Take the count to the vendor.
Ask what happens below the threshold. If the answer is a global or pooled model, ask how you will know when you are on it.
Ask for the study behind any accuracy claim, with the sample and the definition of accuracy. Note whether you get one.
Insist on a backtest against your own last four closed quarters. It is the only test that means anything and it costs the vendor nothing but effort.
Fix stage definitions and stale-deal hygiene first. A model trained on stages that advance when the rep says so will learn exactly that.
The tools are not the problem. The prerequisite is, and it is published, and it takes an afternoon to check.
This is reporting on sales technology and revenue operations. It is not procurement, legal or investment advice.
References
Every figure and legal citation in this article is drawn from the sources below. Where an instrument is proposed rather than in force we say so in the text.
Salesforce, Einstein data requirements for sales. https://help.salesforce.com/s/articleView?id=ai.einstein_sales_data_requirements.htm
Gong, See the forecast projection, published data thresholds, updated 25 February 2026. https://help.gong.io/docs/analyze-see-forecast-projection
Gartner, Press release on the State of Sales Operations Survey, forecasting confidence, 12 February 2020. https://www.gartner.com/en/newsroom/press-releases/2020-02-12-gartner-says-less-than-50--of-sales-leaders-and-selle
CSO Insights, The next generation of forecast accuracy, on the 2017 World-Class Sales Practices Study, sample and fielding period not disclosed. https://www.csoinsights.com/blog/the-next-generation-of-forecast-accuracy/
Makridakis, Spiliotis and Assimakopoulos, The M4 competition: 100,000 time series and 61 forecasting methods, International Journal of Forecasting 36(1), 2020. https://doi.org/10.1016/j.ijforecast.2019.04.014
Fildes, Goodwin, Lawrence and Nikolopoulos, Effective forecasting and judgmental adjustments, International Journal of Forecasting 25(1), 3-23, 2009. https://doi.org/10.1016/j.ijforecast.2008.11.010
Clari, Sales forecasting accuracy benchmarks, cited as an example of secondary sourcing, 27 May 2026. https://www.clari.com/blog/sales-forecasting-accuracy/
How we work. This article was researched and written by the Sales Hub Media editorial team. We do not republish press releases. Every number and legal citation is checked against a primary source, which is named and linked above. Where an instrument is proposed rather than in force, we say so. Corrections are made openly on the article itself, never by silent edit. If you believe something here is wrong, write to info@saleshubmedia.com and tell us what and why.
Filed under Sales Analytics & Forecasting · Get The Weekly Brief