
Almost every tooling ROI claim in this category is correlational, self-reported and published by the seller. Three findings survive that filter. Here they are, with their limits.
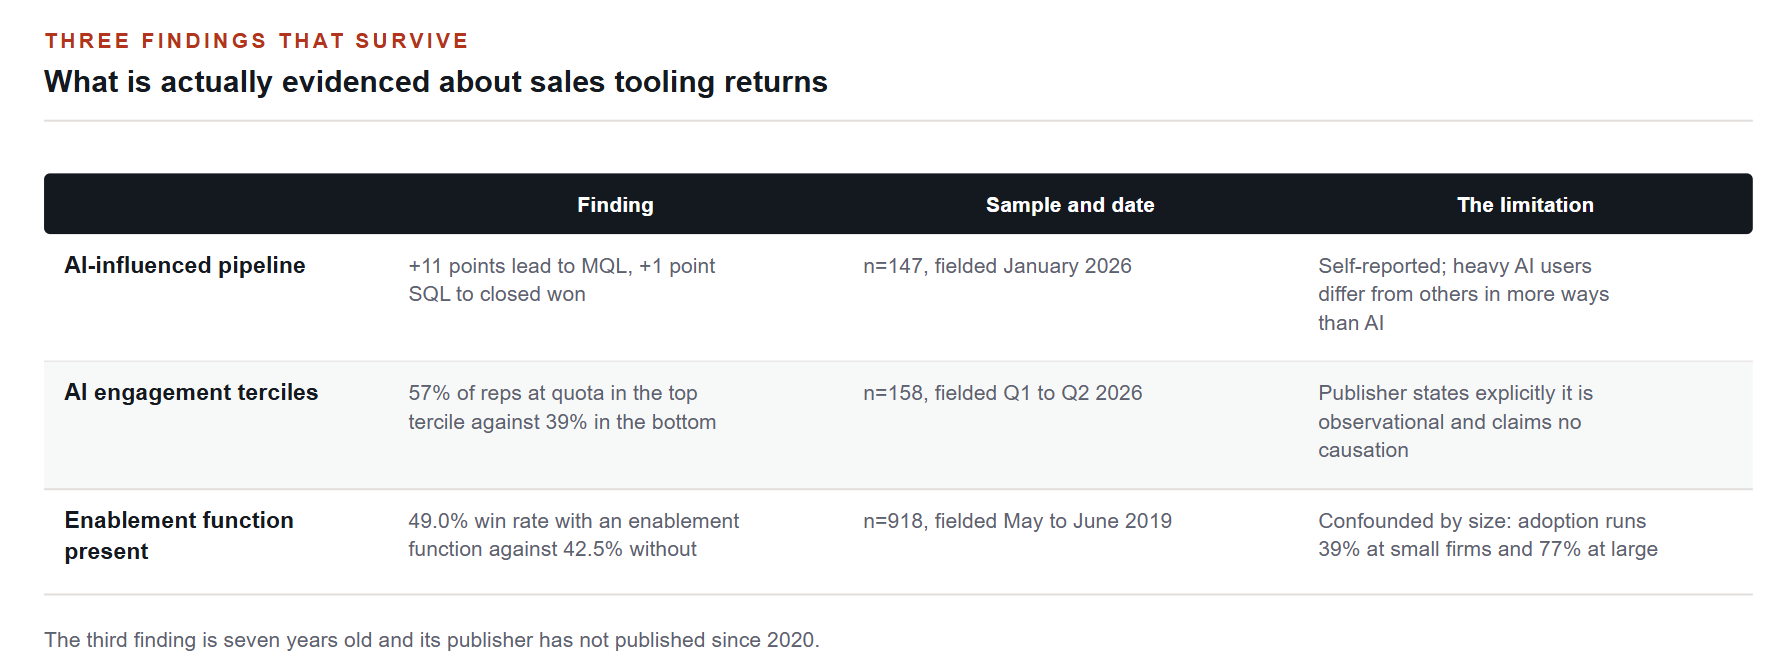
Each row states the finding, the sample, and the limitation that determines how far it can be taken. All three are observational. None establishes causation.
Every sales technology vendor publishes a return figure. Almost none of them will survive a finance review, and the reason is consistent: the studies are correlational, the respondents are self-selected, the outcome is self-reported and the publisher sells the product.
We applied one filter: does the source publish a sample size, a fielding period and an acknowledgement of its own limits? Three findings survived it. They are worth knowing, and they are worth knowing precisely, because each has a limitation that determines what you can do with it.
Finding one: the gain is at the top of the funnel
ICONIQ's 2026 research, fielded in January 2026 across 147 B2B software companies, found that companies with more than half of pipeline AI-influenced converted eleven percentage points better from new lead to MQL and eight points better from MQL to SQL, but only one point better from SQL to closed won and three points better from demo to closed won.
The limitation is self-selection, and it is substantial. Companies with more than half of pipeline AI-influenced are not otherwise average companies. They have the operational capacity to deploy and integrate, which correlates with a great deal else.
What the finding supports is a spending shape rather than a return estimate: the evidenced value sits in qualification and volume, not in closing.
Finding two: the tercile comparison
The Bridge Group's 2026 account executive research, across 158 companies fielded in the first half of 2026, found 57 per cent of reps at quota in the highest AI engagement tercile against 39 per cent in the lowest.
This is the most carefully constructed comparison in the category. The terciles were pre-specified before outcomes were examined, and three negative controls were tested. The publisher states in terms that this is observational data and that it is not claiming bulletproof causation.
It should be read as a strong association with an unresolved direction. High-performing revenue organisations may adopt AI because they are high-performing, rather than the reverse. The honest use is as a reason to investigate, not as a business case input.
Finding three: the enablement correlation, and why it is weaker than it looks
The 2019 sales enablement study across 918 organisations reported a 49.0 per cent win rate at organisations with an enablement function against 42.5 per cent without, and rising with formality: 39.2 per cent for random approaches, 43.3 per cent informal, 48.4 per cent formal and 55.1 per cent formal and charter-based.
The confound is in the same document. Enablement adoption runs from 39.3 per cent at organisations with fewer than 25 sellers to 77.1 per cent at those with more than 500. Larger, better-resourced organisations both adopt enablement and win more. The study cannot separate the two, and it does not claim to.
It is also seven years old, from a publisher that has published nothing since 2020, and the study was distributed as a gated asset by three enablement software vendors.
That is the entire credible evidence base for enablement return. One cross-sectional, single-respondent, uncontrolled study from 2019, confounded by company size, distributed by vendors who sell the category.
What does not survive the filter
Effect claims published without base rates, confidence intervals or confounder controls, of the form that customers are some percentage more likely to increase productivity or report higher win rates. Total economic impact studies built as composite organisations from a handful of vendor-selected interviews. Accuracy claims with no baseline and no definition of accuracy. Any figure whose citation trail leads to another vendor's blog.
We are not naming these to be difficult. We are naming the shape so you can recognise it in a deck.
The measurement design that gives you your own answer
Since the published evidence cannot tell you whether your stack pays for itself, here is the design that can. It takes two quarters and no budget.
Pick one metric per tool, before deployment. Not a dashboard. One number, chosen because the tool claims to move it.
Hold out a group. A team, a segment or a territory that does not get the tool for one quarter. This is the step almost everyone skips and it is the only one that produces evidence rather than anecdote.
Randomise the holdout if you possibly can. Letting teams opt in reproduces exactly the self-selection problem that makes the published research uninterpretable.
Measure by funnel stage. Aggregate movement will hide where the effect is, and on the published evidence the effect is unevenly distributed by stage.
Record seat utilisation from day one. Licences with no activity in thirty days are the fastest line in any business case and the easiest to act on.
Set a kill date. A pilot without an end date becomes a subscription.
One quarter of that design produces better evidence about your organisation than the entire published literature produces about anyone's. That is a statement about the literature rather than about the design, which is not complicated.
A note on what a benchmark can and cannot do. This piece is a review of published third-party research. It is not original survey data, and we are not presenting it as such. When we field our own research we will publish the sample size, the fielding period and the questions asked, and we will report the findings that are inconvenient alongside the ones that are not.
This is reporting on published benchmark data. We state which sources are independent and which are vendor-published. It is not procurement advice.
References
Every figure and legal citation in this article is drawn from the sources below. Where an instrument is proposed rather than in force we say so in the text.
ICONIQ, The State of Go-to-Market in 2026, survey fielded January 2026, n=147, March 2026. https://www.iconiqcapital.com/growth/reports
The Bridge Group, AE Models, Motions and Metrics 2026, n=158, fielded Q1 to Q2 2026, 22 June 2026. https://www.bridgegroupinc.com/research/2026-ae-models-motions-metrics
CSO Insights, Miller Heiman Group, 5th Annual Sales Enablement Study, n=918, fielded May to June 2019, October 2019. https://salesenablement.pro/assets/2019/10/CSO-Insights-5th-Annual-Sales-Enablement-Study.pdf
Salesforce, State of Sales, 7th edition, n=4,050, fielded August to September 2025, vendor-published, 2026. https://www.salesforce.com/en-us/wp-content/uploads/sites/4/documents/reports/sales/salesforce-state-of-sales-report-2026.pdf
How we work. This article was researched and written by the Sales Hub Media editorial team. We do not republish press releases. Every number and legal citation is checked against a primary source, which is named and linked above. Where an instrument is proposed rather than in force, we say so. Corrections are made openly on the article itself, never by silent edit. If you believe something here is wrong, write to info@saleshubmedia.com and tell us what and why.
Filed under RevOps & Pipeline · Get The Weekly Brief