
The forecast is usually wrong for structural reasons, not because reps are optimistic. Four of those reasons are fixable this quarter.
Rewriting stage definitions in buyer terms costs nothing but agreement, and it is the change most revenue teams can make this quarter with the largest effect on forecast quality.
Most forecast inaccuracy is blamed on rep optimism. Some of it is. But a forecast that is consistently wrong in the same direction is not a psychology problem, it is a system problem, and system problems can be fixed without changing anyone's personality.
First, a correction to a statistic you have probably quoted. The line that Gartner found sales forecasts are accurate less than half the time is a misreading. Gartner measured confidence, not accuracy: only 45 per cent of sales leaders and sellers had high confidence in their organisation's forecasting accuracy. Those are different claims. The related figures in circulation, including a median forecast accuracy of 70 to 79 per cent and a claim that only 7 per cent of sales organisations achieve 90 per cent accuracy, could not be traced to any Gartner release, glossary page or citable document. We are not using them and neither should you.
Stage definitions describe activity, not evidence
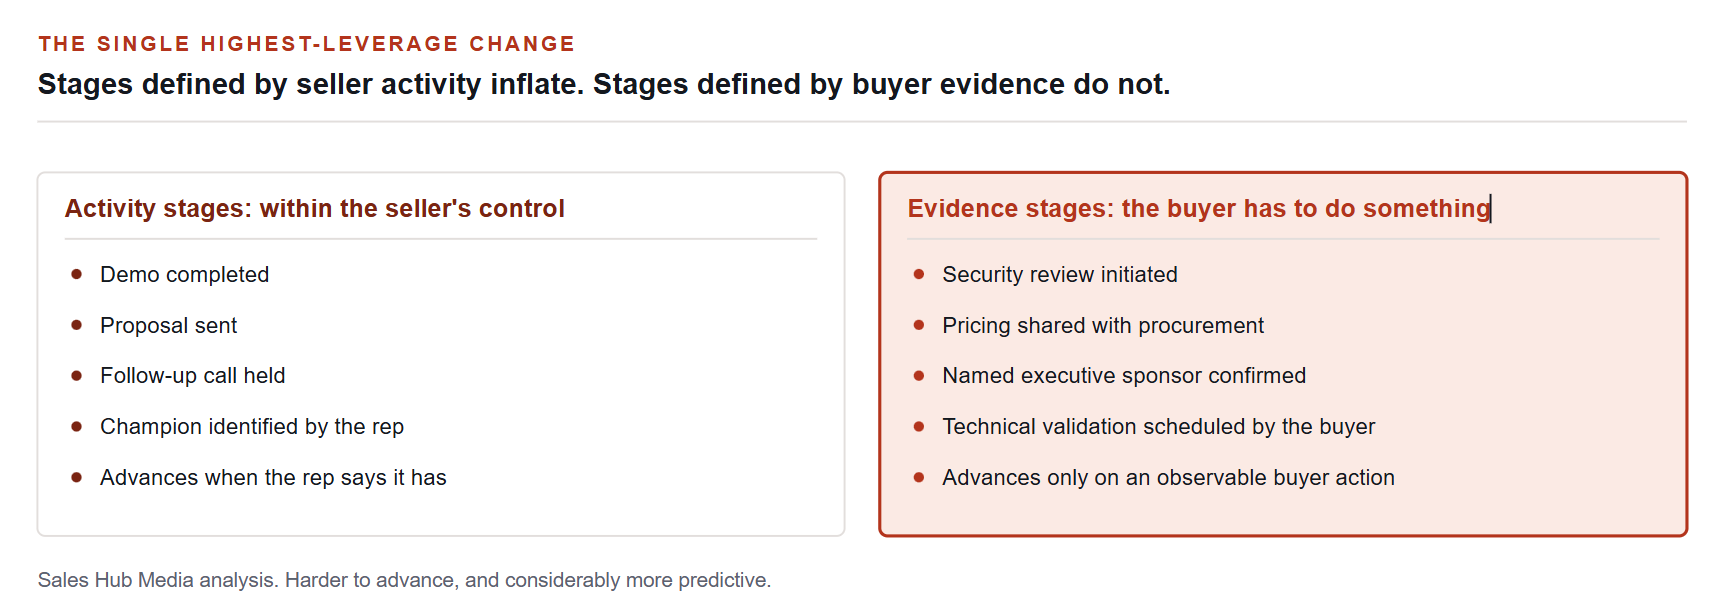
In most CRMs, a stage advances when the rep says it has. If a stage is defined as demo completed, it records that an event happened. It does not record what the buyer did as a result. Stages defined by seller activity inflate, because activity is within the seller's control.
Stages defined by buyer evidence behave differently. Security review initiated, pricing shared with procurement, or a named executive sponsor identified are all things the buyer must do. They are harder to advance and far more predictive.
Rewriting stage definitions in buyer terms is the single highest-leverage change most revenue teams can make to forecast accuracy, and it costs nothing but agreement.
Close dates are set once and inherit forever
A close date entered at creation is a guess. The problem is that it usually persists, and end-of-quarter dates cluster because that is when the rep hopes to close, not when the buyer expects to decide.
A useful discipline is to require the close date to be sourced: what did the buyer say about their timeline, and when did they say it? Deals where nobody can answer that are, by definition, unforecastable.
Nobody is measuring stage-to-stage decay
Aggregate win rate hides the story. What matters is where deals stop. If half of everything entering the evaluation stage never leaves it, the problem is not closing skill, it is qualification or a missing proof point at that specific step.
Teams that track conversion between each stage rather than end to end can name their bottleneck. Teams that track only the total cannot, and default to pressure on the last stage, which is usually not where the loss is happening.
Do not expect an industry benchmark to tell you what good looks like here. We went looking for a credible published stage-conversion table and did not find one with a named publisher, a sample size and a date. The closest usable figures come from ICONIQ's 2026 go-to-market survey of 147 B2B software companies, which reported new lead to MQL at 28 per cent, MQL to SQL at 30 per cent, SQL to closed won at 28 per cent and demo to closed won at 38 per cent. Those are executive self-reports rather than CRM-derived measurements, and they are the best available, which tells you something about the state of the evidence.
Dead deals are never removed
Pipeline accumulates. Opportunities with no activity for two months, or with a close date that has already passed, remain open because closing them out feels like an admission. The result is a pipeline number that flatters coverage and destroys forecast accuracy at the same time.
An automated rule that flags any opportunity with no buyer-side activity in thirty days, and requires a decision rather than a nudge, does more for forecast quality than any prediction model applied on top of bad data.
And while we are here, the coverage ratio
The 3x pipeline coverage rule has no traceable origin. The most serious published attempt to find one, by Dave Kellogg in 2013, concluded plainly that he did not know where it came from and that it survived through the Goldilocks principle: 2x seems tight, 4x seems rich. His substantive objection is the one that matters. Once the rule is institutionalised, managers pressure reps until the pipeline shows 3x, which makes it a self-fulfilling prophecy with, in his words, zero predictive value.
The only coverage benchmark we found with a disclosed sample is ICONIQ's, which put average account executive pipeline coverage at 3.6x in 2025, 3.9x in 2024 and 3.8x in 2023. That is a survey of what companies report holding, not evidence that 3x is correct. The defensible calculation is coverage equal to one divided by your win rate, adjusted for where you are in the period.
What a better review looks like
The most useful pipeline reviews spend their time on evidence rather than status. Not what stage is this in, but what did the buyer do most recently, who else in the account is involved, and what specifically has to be true for this to close in the period claimed.
Three deals examined properly tell you more about the quarter than thirty read out from a list.
This quarter, pick one: rewrite stage definitions in buyer evidence, or enforce a stale-deal rule. Both are free. Both work.
This is reporting on sales technology and revenue operations. It is not procurement, legal or investment advice.
References
Every figure and legal citation in this article is drawn from the sources below. Where an instrument is proposed rather than in force we say so in the text.
Gartner, Press release on the State of Sales Operations Survey, forecasting confidence and data quality, 12 February 2020. https://www.gartner.com/en/newsroom/press-releases/2020-02-12-gartner-says-less-than-50--of-sales-leaders-and-selle
Dave Kellogg, Kellblog, The self-fulfilling 3x pipeline coverage prophecy, 19 April 2013. https://www.kellblog.com/the-self-fulfilling-3x-pipeline-coverage-prophecy/
ICONIQ, The State of Go-to-Market in 2026, survey fielded January 2026, n=147, March 2026. https://www.iconiqcapital.com/growth/reports
The Bridge Group, AE Models, Motions and Metrics 2026, n=158, fielded Q1 to Q2 2026, 22 June 2026. https://www.bridgegroupinc.com/research/2026-ae-models-motions-metrics
How we work. This article was researched and written by the Sales Hub Media editorial team. We do not republish press releases. Every number and legal citation is checked against a primary source, which is named and linked above. Where an instrument is proposed rather than in force, we say so. Corrections are made openly on the article itself, never by silent edit. If you believe something here is wrong, write to info@saleshubmedia.com and tell us what and why.
Filed under RevOps & Pipeline · Get The Weekly Brief