
Account executive ramp is at a record high. SDR ramp is at a fifteen-year low. Both figures come from the same publisher, and the divergence is the finding.
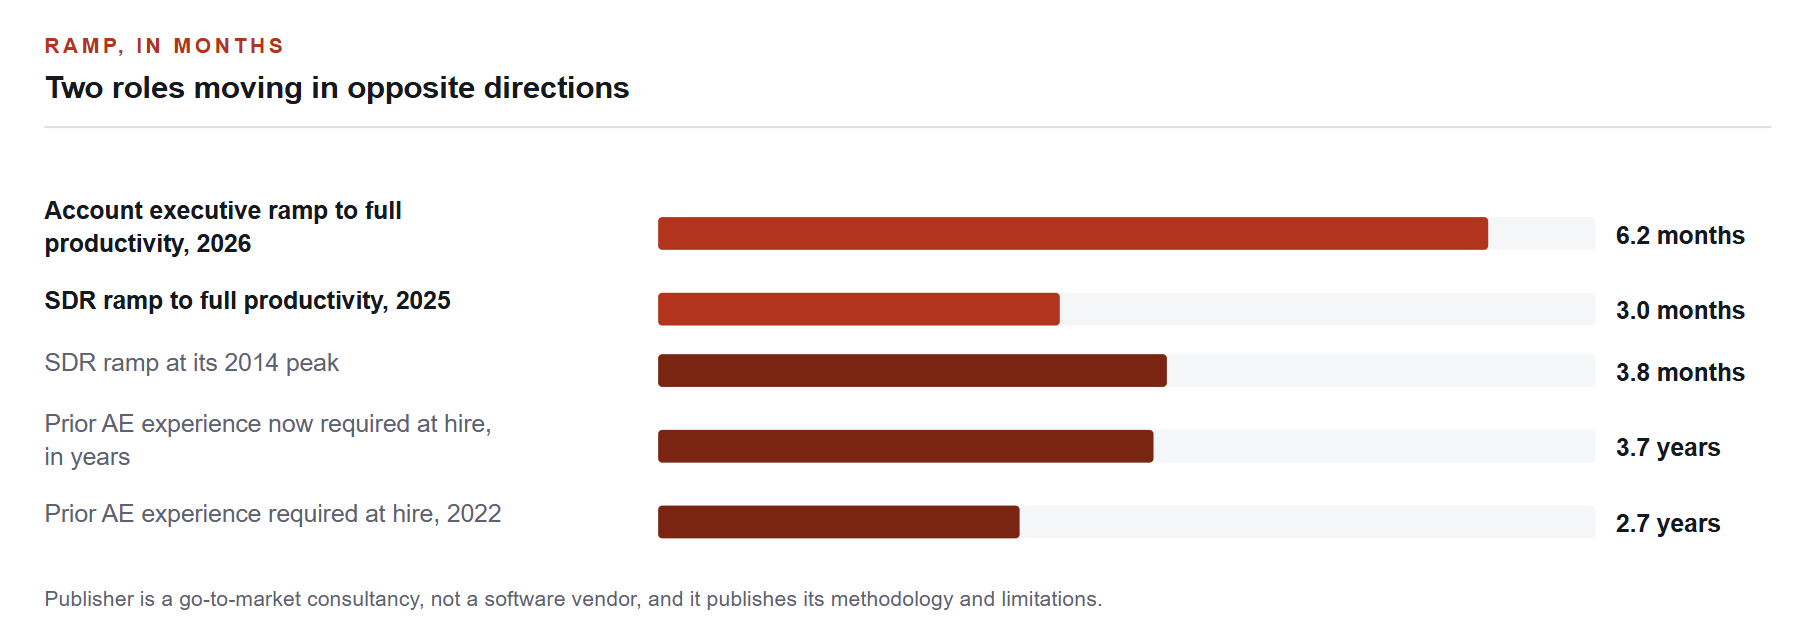
The Bridge Group, AE report published 22 June 2026 (n=158, fielded Q1 to Q2 2026) and SDR report published 6 February 2025 (n=351, fielded 2024 to 2025). Different roles, different survey years, different samples. Do not average them.
Ask how long a new rep takes to ramp and you will get a number. Ask where the number came from and the conversation usually stops.
There is in fact one publisher producing methodologically documented ramp benchmarks in B2B sales, and its two current editions say something more interesting than a single figure would.
The numbers
Account executive ramp to full productivity now averages 6.2 months. That is the highest in the study's history. The publisher attributes it to increasing deal complexity and buying committee size, particularly at higher average selling prices.
SDR ramp averages 3.0 months, the lowest since 2010, down from a peak of 3.8 months in 2014. The publisher's own explanation is a hedge rather than a finding: it may reflect AI-assisted onboarding, or it may reflect tightening management expectations on time to productivity. Those are different things with different implications and the survey cannot distinguish them.
Account executive ramp is at a record high while SDR ramp is at a fifteen-year low. Do not average them, and do not describe either as the ramp trend. They are different roles, measured in different years, on different samples.
What sits underneath the AE number
The ramp figure has not moved alone. Prior experience required at hire has risen from 2.7 years in 2022 to 3.7 years. The publisher's reading is that at higher average selling prices, the era of the junior account executive is largely over.
Read those two together and the picture is uncomfortable. Companies are hiring more experienced sellers and those sellers are taking longer to become productive. That is not an onboarding failure, it is a signal that the deal itself has become harder to learn: more stakeholders, longer cycles, more internal process on the buyer's side.
The same 2026 survey supports that reading directly. Near-majorities of respondents reported increases in stakeholder count, sales cycle length, discounting pressure, deal slippage and required pipeline coverage compared with the previous year.
Median account executive quota now sits at $960,000 against median on-target earnings of $200,000, a quota-to-earnings ratio of 4.6x, up from 4.2x in 2024. Thirty-eight per cent of account executives now carry sole or blended ownership of renewal and expansion, nearly double the 2024 figure.
The attrition data is the most useful part, and almost nobody cites it
The SDR report decomposes turnover in a way that is rare and immediately actionable. Annual SDR attrition ran at a median of 40 per cent, with the twenty-fifth to seventy-fifth percentile spanning 21 to 57 per cent. The split: 13 per cent involuntary, 11 per cent voluntary, 16 per cent promotions.
That decomposition changes the diagnosis. A 40 per cent headline sounds like a retention crisis. Once you separate it, the largest single component is promotion, which is the system working. The concerning movement is elsewhere: promotions have halved from 34 per cent in 2020, while average SDR tenure has risen to 1.9 years, the highest since the early 2010s.
People are staying longer and being promoted less. In a market with a competitive account executive job market and a wave of layoffs behind it, that is a stalled career ladder rather than improved retention, and it will show up in engagement before it shows up in attrition.
What nobody has measured
We looked for evidence connecting onboarding programme design to ramp outcome. There is none.
No source we could verify publishes onboarding or enablement programme length against measured ramp effect. The organisation that historically published in this space lists reducing new-person ramp time as an enablement goal and publishes no ramp measurement at all, and its last edition was 2019.
The cost of replacing a sales rep is in the same position. The figures in circulation, including the widely repeated $97,000 and the six-times-salary rule, could not be traced to any named dated primary source. We are not printing them.
So the honest state of the evidence is: we know how long ramp takes, we know it is getting longer for account executives, and nobody has published anything credible about what shortens it.
What to do with this
Benchmark within your own average selling price band. Ramp scales with deal complexity, and a cross-segment average will mislead you in both directions.
Measure ramp as time to a defined productivity threshold, and write the threshold down. Most organisations that quote a ramp figure cannot say what it is a ramp to.
Split your attrition into voluntary, involuntary and promotion before you diagnose it. A single percentage hides the only interesting question.
Track promotion rate as a leading indicator. It moved before tenure did in the published series, and it will in yours.
If you are asked to justify enablement spend on ramp reduction, be aware that no published evidence supports the causal claim. Build the case on your own before-and-after measurement instead.
A note on the source. The Bridge Group is a go-to-market consultancy, not a software vendor. It publishes its sample size, fielding period, respondent profile, citation format and stated limitations, which puts it well above the norm for this category. It is still a commercially interested publisher and its data is observational survey work, not controlled measurement. The segmented ramp figures by deal size sit inside the gated report rather than on the public pages, so we have published only the headline averages.
This is reporting on published benchmark data. We state which sources are independent and which are vendor-published. It is not procurement advice.
References
Every figure and legal citation in this article is drawn from the sources below. Where an instrument is proposed rather than in force we say so in the text.
The Bridge Group, AE Models, Motions and Metrics 2026, 10th edition, n=158, online survey fielded Q1 to Q2 2026, 22 June 2026. https://www.bridgegroupinc.com/research/2026-ae-models-motions-metrics
The Bridge Group, SDR Models, Motions and Metrics 2025, 10th edition, n=351, fielded 2024 to 2025, 6 February 2025. https://www.bridgegroupinc.com/research/2025-sdr-models-metrics-report-the-bridge-group
The Bridge Group, 2026 AE compensation, quota and AI metrics, summary post, June 2026. https://blog.bridgegroupinc.com/2026-ae-compensation-quota-ai-metrics
CSO Insights, Miller Heiman Group, 5th Annual Sales Enablement Study, n=918, fielded May to June 2019, final edition of the series, October 2019. https://salesenablement.pro/assets/2019/10/CSO-Insights-5th-Annual-Sales-Enablement-Study.pdf
How we work. This article was researched and written by the Sales Hub Media editorial team. We do not republish press releases. Every number and legal citation is checked against a primary source, which is named and linked above. Where an instrument is proposed rather than in force, we say so. Corrections are made openly on the article itself, never by silent edit. If you believe something here is wrong, write to info@saleshubmedia.com and tell us what and why.
Filed under Enablement, Coaching & Readiness · Get The Weekly Brief