
The famous figures for the cost of bad data do not survive checking. Here is a model you can run on your own organisation instead, which is more useful anyway.
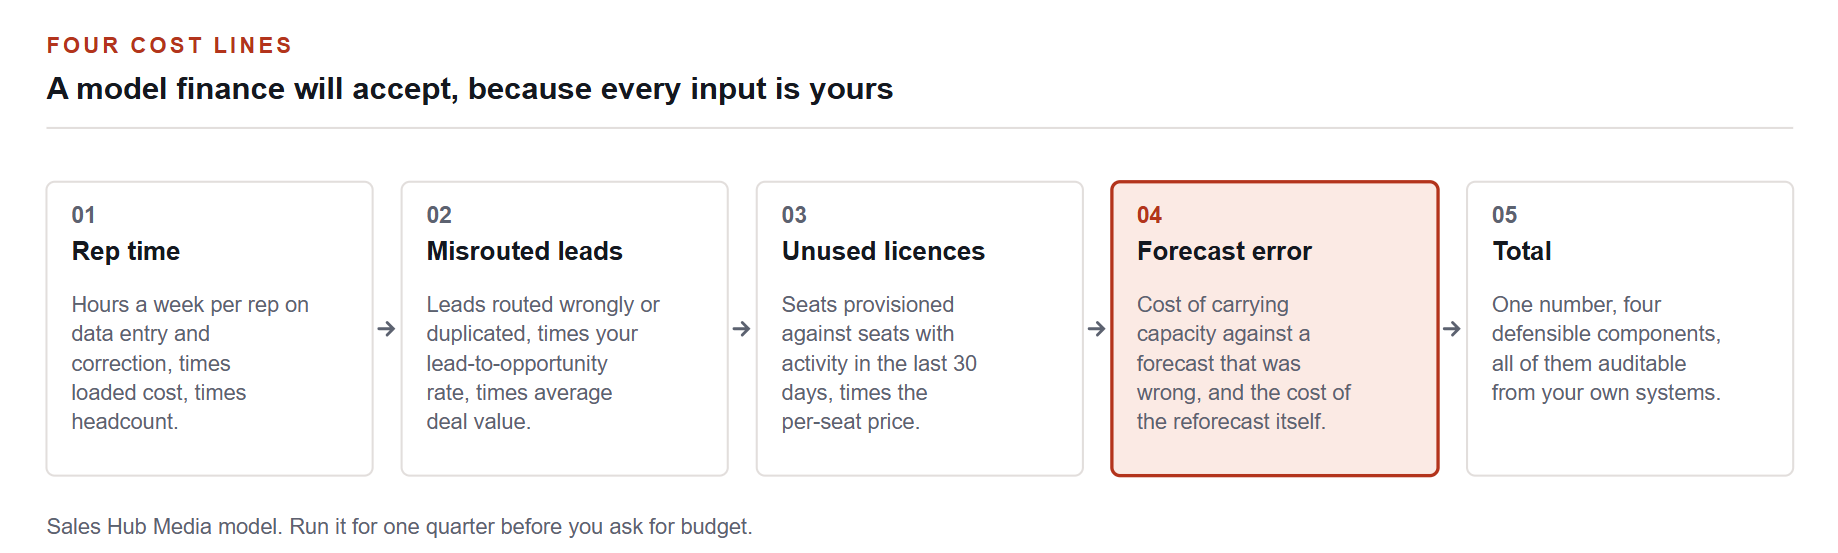
Each stage uses a number your organisation already holds. No industry benchmark is required, which is fortunate, because the industry benchmarks in this area do not check out.
Everyone building a business case for CRM data quality reaches for the same statistics. Poor data quality costs the average organisation $12.9 million a year. Bad data costs the US economy $3 trillion. B2B contact data decays at 22.5 per cent a year.
We went looking for the sources. What we found should change how you build the case.
The famous numbers, checked
The $3 trillion figure is real in the sense that it was published. Thomas C. Redman wrote it in the Harvard Business Review on 22 September 2016 under the headline that bad data costs the US $3 trillion per year. Two things are routinely lost in the retelling. It is an economy-wide figure, not a per-organisation one, and it is repeatedly cited as though it were the latter. And the derivation sits behind a paywall, so almost nobody quoting it has read how it was calculated.
The $12.9 million average is attributed to Gartner. We could not verify it this time. Gartner's site refuses automated retrieval, the article that carried the figure lived on a blog Gartner has since retired, and an earlier Gartner figure of $9.7 million circulated before it. The two are frequently conflated. We are not printing the number, and we would suggest you do not put it in a board paper without seeing the current source yourself.
The data decay rates, the annual contact churn figures and the various percentages for how fast a database goes stale trace overwhelmingly to data vendors selling the remedy, with no originating study behind them.
A business case built on a statistic your CFO can fail to verify in ninety seconds is a business case that dies in the room. Use your own numbers.
One verified anchor worth keeping
Gartner's State of Sales Operations survey did produce a figure that survives checking and is more useful than the cost estimates anyway: only 47 per cent of respondents believed their organisations had high-quality data, and 13 per cent reported that overall data quality was in fact poor. That establishes the problem is widespread without pretending to price it.
It is worth noting that the sample size and fielding period are not disclosed on the release, which is a limitation you should state if you cite it.
The model: four lines, all auditable
Line one: rep time
Take the hours a week each rep spends on data entry, correction and finding information that should already be in the system. Multiply by loaded cost per hour, by headcount, by 46 working weeks.
Get the hours from a two-week time log across a sample of reps rather than from a survey. Every published figure for how salespeople spend their time comes from vendor-commissioned self-report, the one instrumented study we found discloses neither its sample size nor its fielding period, and the largest vendor's own published series has moved from 28 per cent selling time to 30 per cent to 40 per cent across three editions without explaining the change. Your own log will be better evidence than any of them, and it will be evidence about you.
Line two: misrouted and duplicated leads
Count the leads in one quarter that were routed to the wrong owner, sat unactioned past your SLA, or existed as duplicates. Multiply by your lead-to-opportunity conversion rate and by average deal value.
This is the line finance finds most persuasive, because it is a foregone revenue number derived entirely from internal data with no assumption imported from outside.
Line three: licences nobody uses
Compare seats provisioned against seats with any activity in the last thirty days. Multiply the gap by the per-seat price and by twelve. This is usually the fastest line to produce and the easiest to act on, and it frequently pays for the remediation project by itself.
Line four: forecast error
The hardest to quantify and the one worth the effort. When the forecast was wrong last year, what did the business do as a result? Hiring approved against revenue that did not arrive, inventory or capacity committed, a reforecast exercise that consumed a fortnight of finance and RevOps time. Price those events. They are real costs and they trace back to the quality of the underlying records.
Where the data actually degrades
Three failure points recur, and none is fixed by buying an enrichment subscription.
The first is the moment of entry, where required fields with no validation produce records that are technically complete and practically useless. The second is ownership change, where a rep leaves and their records enter a state nobody is accountable for. The third is integration, where two systems disagree about which is authoritative and both keep writing.
Enrichment tools address staleness. They do not address any of those three, which is why organisations that buy enrichment first are frequently disappointed. Fix entry validation, assign ownership on departure, and settle the system of record. Then enrich.
The order of operations
Run the four lines for one quarter using your own systems. Do not import a benchmark.
Fix the licence line immediately, because it is free money and it buys credibility for the rest.
Fix entry validation before buying any enrichment, because enriching a badly structured record produces a well-populated badly structured record.
Set an ownership rule that triggers on departure, not on discovery.
Decide the system of record for each object and turn off the competing write.
Re-run the four lines the following quarter. That comparison is the only proof anyone will accept.
What we could not verify, stated plainly. The Gartner $12.9 million average annual cost of poor data quality, the IBM $3.1 trillion figure, and every published B2B data decay rate. If you have a primary source for any of them with a date and a method, write to us and we will publish it.
This is reporting on published benchmark data. We state which sources are independent and which are vendor-published. It is not procurement advice.
References
Every figure and legal citation in this article is drawn from the sources below. Where an instrument is proposed rather than in force we say so in the text.
Thomas C. Redman, Harvard Business Review, Bad data costs the U.S. $3 trillion per year, 22 September 2016. https://hbr.org/2016/09/bad-data-costs-the-u-s-3-trillion-per-year
Gartner, Press release on the State of Sales Operations Survey, data quality findings, 12 February 2020. https://www.gartner.com/en/newsroom/press-releases/2020-02-12-gartner-says-less-than-50--of-sales-leaders-and-selle
Salesforce, State of Sales, 7th edition, n=4,050, fielded August to September 2025, vendor-published, 2026. https://www.salesforce.com/en-us/wp-content/uploads/sites/4/documents/reports/sales/salesforce-state-of-sales-report-2026.pdf
Pace Productivity, How sales reps spend their time, instrumented time study, sample size and period not disclosed, posted February 2017, modified April 2020. https://www.paceproductivity.com/single-post/2017/02/09/how-sales-reps-spend-their-time
How we work. This article was researched and written by the Sales Hub Media editorial team. We do not republish press releases. Every number and legal citation is checked against a primary source, which is named and linked above. Where an instrument is proposed rather than in force, we say so. Corrections are made openly on the article itself, never by silent edit. If you believe something here is wrong, write to info@saleshubmedia.com and tell us what and why.
Filed under CRM & Sales Platforms · Get The Weekly Brief