Nobody has published the number. Not a vendor, not an analyst, not an academic. An entire category priced on predicting purchase has never disclosed the one figure that would prove it works.
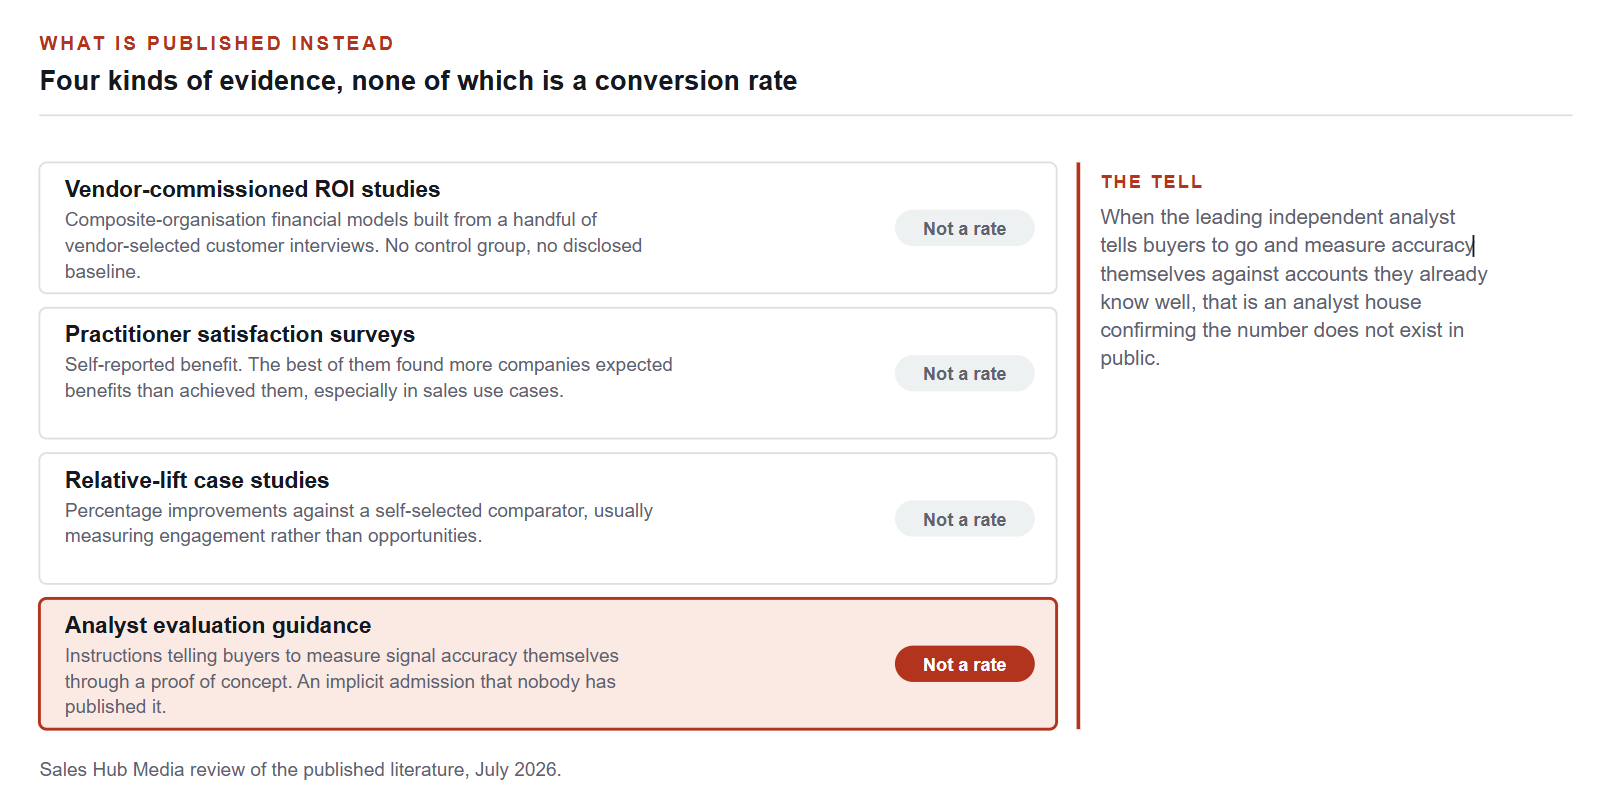
Everything published about intent data performance falls into one of these four categories. None of them answers the question a buyer is actually asking.
Here is the question every buyer of intent data asks in the first meeting: of the accounts you flag, what proportion turn into opportunities?
We went looking for the answer across the vendors, the analyst houses and the academic literature. It is not published anywhere. Not by Bombora, 6sense, Demandbase, ZoomInfo, G2, TechTarget or any of the other providers. Not by an analyst house publicly. Not in any peer-reviewed source we could find.
For a category whose entire value proposition is predicting purchase intent, that is the most significant fact about it.
What gets offered instead
Vendor-commissioned ROI studies. The best-known are the Total Economic Impact studies published by Forrester and paid for by the vendor. 6sense's reported 454 per cent return in June 2022 rests on nine customer interviews. ZoomInfo's 316 per cent, published December 2025, rests on five decision-makers. Demandbase's 367 per cent from April 2022 does not disclose an interview count in the release.
The method is a composite organisation: a financial model built from a small number of vendor-selected interviews, with no control group and no disclosed baseline. The frequently quoted 4x increase in win rate attributed to 6sense is a composite-organisation figure from a study the vendor commissioned, based on nine interviews, with no baseline win rate stated. It is not a conversion rate and it should never be cited as one.
Satisfaction surveys. The most credible independent work is Forrester's Q1 2023 global intent data survey. More than 85 per cent of companies using intent data reported business benefits, and more than 70 per cent used multiple providers. Forrester also reported that more companies expected benefits than achieved them across every benefit surveyed, with the gap widest in sales use cases and revenue growth. Notably, Forrester does not publish an n for that survey, which is itself striking for the most-cited independent research in the category.
Relative lift. The most substantial recent example is a joint study by INFUSE and G2 reported in July 2026, covering 243,000 accounts flagged by G2 buyer intent and 19,200 engaged accounts across more than 130 campaigns and 11 cybersecurity programmes, tracked over six to twelve months. Accounts appearing in both sources generated 21 per cent more leads per account and 93 per cent higher multi-touch engagement.
That is relative lift, the outcome measured is engagement rather than opportunities, the comparator is self-selected, and both authors sell the products being evaluated. It is nonetheless the most transparent artefact in the category, and it contains the single most useful number we found.
The overlap between two signal sources on the same accounts was 42 per cent, ranging from 22 per cent to 90 per cent across only eleven programmes. Overlap is not a stable property. Two sources agreeing about who is in market is itself highly variable.
The accuracy question underneath
Conversion cannot be assessed without knowing how often the flag is wrong, and that is not published either.
The only vendor acknowledgement we found is Bombora's, which stated in 2021 that single-vendor identity-graph approaches yield a fair amount of false positives, adding that it knows because it has evaluated them all. No number is attached, and Bombora publishes no false-positive rate, precision figure or match rate for its own signal.
There is no accreditation, no industry standard and no independent audit covering B2B intent signal accuracy. The IAB Tech Lab's data transparency label certifies that a provider discloses how a segment was built, not that the segment is correct.
The nearest rigorous independent evidence concerns the address layer and is about geolocation rather than company resolution, so it should not be presented as a match rate. A 2026 Virginia Tech study across 37,302 observations in 175 countries found median geolocation error of 179 to 207 kilometres on mobile networks against 3 to 16 kilometres on fixed, with failure rates beyond 100 kilometres at 53 to 61 per cent in Asia and 66 to 72 per cent in Africa against 9 to 20 per cent in Europe. It measures something different. It is a reasonable reason to interrogate coverage claims outside North America and Western Europe with more force than is customary.
A warning about one specific source
During this research we encountered a benchmark page presenting itself as a 2025 compilation of B2B intent data benchmarks. It states that intent-prioritised accounts convert to closed opportunity at 21.3 per cent against 8.4 per cent, attributed to a Forrester 2024 B2B buying study.
That study does not exist. Nor does a Bombora 2024 Company Surge Performance Report cited on the same page. Two further citations name research organisations that were retired in 2019 and 2020. Several of the page's own citation links point nowhere.
We are flagging it because the figures are already propagating and were returned to us as fact by a search summariser during this work. Put the numbers on an internal do-not-use list rather than the domain, because the attributed source name changes as they spread.
What a buyer should do instead
Forrester's own evaluation guidance is the practical answer, and it is an admission dressed as advice: determine signal accuracy yourself, measure overlap with your existing sources yourself, and do it through a narrow-keyword proof of concept over weeks rather than months, validated against accounts you already know well.
Take fifty accounts you know were in a buying process last year. Ask the provider to show what it flagged, and when. That is the whole test.
Measure precision, not volume. A provider that flags more accounts is not performing better.
Run two providers over the same account set for one quarter and measure the disagreement. Nobody has published this and it will tell you more than any case study.
Track flagged-to-opportunity yourself from day one, and hold it as a number you own. Almost nobody does, which is why the category has never had to publish one.
Treat any conversion percentage quoted at you as fabricated until the sample size and the denominator arrive.
None of this means intent data does not work. Plenty of teams get real value from it. It means the category has been sold for a decade on a claim that has never been evidenced in public, and the only way to know whether it works for you is to measure it yourself.
This is reporting on published benchmark data. We state which sources are independent and which are vendor-published. It is not procurement advice.
References
Every figure and legal citation in this article is drawn from the sources below. Where an instrument is proposed rather than in force we say so in the text.
Forrester, Intent data expectations versus reality, on the Q1 2023 Global B2B Intent Data Survey, 26 October 2023. https://www.forrester.com/blogs/intent-data-expectations-vs-reality-whats-working-and-where-are-the-gaps/
Forrester, How to evaluate intent data providers, 1 July 2025. https://www.forrester.com/blogs/how-to-evaluate-intent-data-providers/
Bombora, Company Surge intent data still works despite challenges, the only vendor acknowledgement of false positives we located, 28 October 2021. https://bombora.com/blog/bomboras-company-surge-intent-data-still-works-despite-challenges-like-remote-work-and-the-cookieless-future/
Demand Gen Report, Coverage of the INFUSE and G2 joint intent study, authored by both vendors, 16 July 2026. https://www.demandgenreport.com/
Nabi et al., Virginia Tech, Lost in the prefix: revisiting IP geolocation accuracy across networks and geographies, arXiv:2605.21937, 21 May 2026. https://arxiv.org/abs/2605.21937
IAB Tech Lab, Data Transparency Standard, which certifies disclosure rather than accuracy. https://iabtechlab.com/standards/data-transparency/
How we work. This article was researched and written by the Sales Hub Media editorial team. We do not republish press releases. Every number and legal citation is checked against a primary source, which is named and linked above. Where an instrument is proposed rather than in force, we say so. Corrections are made openly on the article itself, never by silent edit. If you believe something here is wrong, write to info@saleshubmedia.com and tell us what and why.
Filed under Intent Data & Buying Signals · Get The Weekly Brief